Joining the dots for modern data science workflows

State of the art workflows not just for Computer Scientists

Nick Young, Jens Brinkmann

The University of Auckland

July, 2024

What this is

  • efficiently create a chain of our preferred tools to tackle a map visualisation part of a ficticious PhD
  • end-to-end’ with focus on Research Reproducibility
  • Though geospatial example, but the tools and workflows are applicable to many research disciplines

Housekeeping 🧹

  • This is a taster/talking-head, not a hands-on session 🗣️

  • We only have one hour 🕐 but you can learn a lot

    • We hand-picked the most relevant bits
    • we ask you not to prepare lunch or read a book or message others, just honour our work and time by trying to stay as alert ‼️ as possible.
    • Resources shared later, always prioritise following-along over note-taking, etc. 📝
    • This session won’t be recorded 📹
  • Cameras on, please 📸

  • Please mute your microphone 🎤

  • Questions later unless unavoidable now: Zoom chat 💬

  • Be kind 😊

    • all details of the Code of Conduct 🗞️ can be found here

Recommendation

  • Now, buckle up 🏎️
  • try to follow me, this is a lot of content.
  • we iterate over the same topic 3 times, each time with a different approach

Handling questions

  • Probably very limited time for questions, but
    1. Drop-in Clinic (Tuesday/tomorrow, 3-4pm)
    2. HackyHour community and Slack channel (availble for all, not jut University of Auckland)
  • Slides, repo, links shared afterwards
  • pointers to relevant ResBaz sessions
    • some might be full
    • some might share slides on request, might(!)

Go, go, go! Wait, what?

  • What of the covered parts matters most to you, depends on your research
  • I share opinions/experiences/preferences.
    • try to listen firstly; try it out; find your own solutions; share your findings/preferences/outputs with me later
  • Focus is
    • recent (not dated)
    • relevant (to many research disciplines, not just research involving geospatial)
    • chain of tools and adequate usage to
    • facilitate your research

Goal: make your (research) lives easier

  • Don’t reinvent the wheel 🛞
    • Use existing work IF ADEQUATE! (citing, data sensitivity, intellectual property, licenses, funding, … the list goes on!)
  • Make it FAIR (Findable, Accessible, Interoperable, and Reusable) and benefit from that
  • Focus on your research, not on learning tools
  • keep Reproducibility in mind! Excellent resource here

Overview of the ficiticous project

  • our project is part of a PhD project (usually 3-5 years runtime)
    • 1 hour up to 3 years (or more?) and you can mix-and-match components
  • We picked a geospatial example
    • Why? Many can appreciate an enhanced map (other topics might require jargon, etc.)
    • Even if your research does not invovle geospatial aspects: You are in the right session 😎 It is about the process not so much the product
  • For this project, we made sure that we are allowed to obtain/capture | posess and store | use | (work on with AI support) | publish as it is not senstivite.
  • Parties that might have an influence: Ethics Committee, IP, Commerical Interest, Countries, supervisor,…

More details about data sensitivity, etc.

The workflow’s components - a Pyramid scheme

Component 1: the physical computer

  • this can be many things
    • your local laptop (don’t forget it on the bus 🚌)
    • your office computer 🏢
    • your lab-groups’ computer 🔬
    • a Virtual Machine 📡
      • 3 sentences about VMs
      • we will use one in our project
    • a cloud resource ☁️ (might be obfuscated, might be a server similar to a VM)

Component 2: the operating system

  • Selected tools are maximised for
    • being Operating System (OS) agnostic
    • they should work on many systems
    • some (!) trouble-shotting in aforementioned Drop-in Clinic or over Slack

Note

because of the way we interact with the core-coding task, we won’t see too much of the OS

Component 3: the programming language

  • we will use Python 🐍
  • Python vs. R vs. C vs. Rust vs. JS, … is out of scope
  • Try one of these sessions If your goal is…
    • … efficient Machine Learning: Julia
    • … statistics and refined plots (yes, I am looking at you, ggplot2): R
    • … the Swiss Army Knife®: Python

(all these ResBaz session are running concurrently on Wed. 1-5pm)

Component 4: Libraries

  • We will talk more about packages/libraries in due course
  • For now: Python has a vast amount of libraries
  • we will use GeoPandas among others
  • efficiently handling these might appear daunting
    • but we will show you some tricks
    • many others have done this before!

Component 5: the programming environment

We have two main appraoches

command-line interface (aka CLI/terminal/console/shell/BaSH/ZSH/Fish/…):

  • automatically, for ex. every night at 11pm (cron-job)
  • chain one scripts output as an input to another script (build a pipeline)

Jupyter Notbooks, etc.:

  • develop your code
  • explore your data
  • get interactivity
  • run bits and pieces in Isolation

Option A: Command-line-based

  • we can get a lot done by only using a CLI
  • open a terminal locally or log in to a VM (via SSH, etc.)
  • we can code in a text editor

Recommended ResBaz session

Option A in action

Option B: GUI-based; .py files

GUI = graphical user interface

  • why do we use a GUI? To get help!
    • syntax highlighting
    • auto-complete
    • potentially AI-support 1
  • we can use our local computer (, , ) or x11/ rdp into a virtual machine
  • there is again quite a variety
  • I pick Visusal Studio Code (VSC), others use Jetbrains PyCharm, etc.
    • VSCodium: open-source adaption without telemetry; no MS VS Marketplace but its own; at times less smooth

Option B - Jupyter Notebooks/.ipynb files:

  • maximise the GUI-use: Jupyter Notebooks1
  • Imagine a pharmacy-student’s lab notebook.
    • There are some hard-facts (graphs, print-outs,…) and explanations around it
  • in Jupyter, we can have code blocks, text blocks, images, …
    • to beautify we can use markdown syntax
      • a different take than MS-Word cusor-highlight-text-to-bold approach
  • but: Why add explanations/metadata in the first place? - collaboration/colleagues need to know rationale/units [\(m\) vs \(mm\)] - future-you:
    • again: FAIR and metadata, utlimately: get more research impact

Option B in action

Pyramid revisited: Research Reproducibility perspective

  • What can we do to maximise Reproducibility?1
  • Handling data with code has some advantages over GUI spreadsheet tools where you accidentally click on a cell and move it, etc.

Intermezzo: Let’s see some of that in action

Just 5 lines of code

We can do this in Google Colab, example here

import pandas as pd
pd.options.plotting.backend = "plotly"
import yfinance
df = yfinance.Ticker("^NZ50").history(period="max")# Load data from Yahoo Finance
df[["Open", "Close", "High", "Low"]].plot(labels={"value": "$ NZD"}, title="NZX 50 Index") # plot it

Intermezzo: How does that look on Google Colab

Version Control with Git and GitHub

  • local machine only(bus 🚌 risk) even VM (decommissoned?) isn’t enough
  • if all stakeholders agree (Research Data Policy, Ethics Commission, IP Advisor, Funder,…)
    • we can host our code on a specific version controlled repository
  • track changes/ we don’t want file names such as Thesis final final really final 2 july.docx, great for code
  • while 1 is the underlying ‘technique’/foundation GitHub is one(!) commercial (now owned by Microsoft) entity
    • there are alternatives, GitLab, BitBucket, …
    • some are open source, some run in the cloud, some run on your local machine
  • we don’t have the time for the details, but we have Introduction to version control with Git (Thu, 9am-12pm)

VSC and GitHub

  • VSC we can either use the lefthand side-panel for git (once extension is installed), or we can use the CLI below to do
    • git status, git diff, git commit -am "present-tense active what I did"1, git push
  • GitHub can also provide us with
    • GitHub Actions (throw-away-VMs running on MSAzure)
    • Some basic Project Management via Issues
    • Collaboration (allow other to work on your code)
    • private and public repos
    • there are academic discounts, …

Packages 🎁 : A gift 👑 & a curse 🤬

A gift 👑 because:

  • Python makes it easy to integrate
  • incredible amount of packages exist
  • so no reinventing the wheel (build on other peoples’ extended efforts)1

A curse 🤬 because:

  • things tend to break
    • people discontinue packages
    • “breaking changes” require us to change our syntax
    • packages depend on other packages (think of a big tree🌲)

But! We are not the first people to run into such challenges

  • package management: there are different ways of minimising that impact; let me show 3

    • manually creating a references.txt file (part of the following demo)
    • pip freeze > references.txt (also part of the following demo)
    • poetry
  • there are others, Anaconda, Hatch, just to name a few

To venv or not to venv?

(Though not crucial, mentioned for the sake of completeness)

  • What is this venv?
    • This is one way (there are others) of creating a virtual environment.
  • Each venv can have its own packages and versions; as opposed to a global enviroment (so you can run the old and the new version in paralell and test, etc.)
  • Some consider it good practice to keep one venv per project. If you research and use of Python on one specific machine is just about one project, this might be ignorable; poetry (as mentioned on the previous slide) spins up a virtual environment anyways for you
  • overall, this kind of encapsulation can support Reproducibility

Revisit the Pyramid

(input data properly stored ✅ we use an IDE (VSC) ✅ use package management ✅)

  • Containers (Think of a mini-VM) Docker, Kubernetes
    • Pick/reference an OS (say Ubuntu 22.4) + a Python version (say 3.11.6), etc.
    • your local/VM machine runs Kernel and VSC
    • put the result on DockerHub
  • BinderHub: you can package a remote Git repository into an interactive Jupyter notebook for displaying code and output
  • Research Object (RO) Crate: an approach to package research data and its metadata human and machine readable
    • the Workflow aspect can ingest or generate an RO-Crate that describes the complete processes, authorship, and requirements of a computational workflow

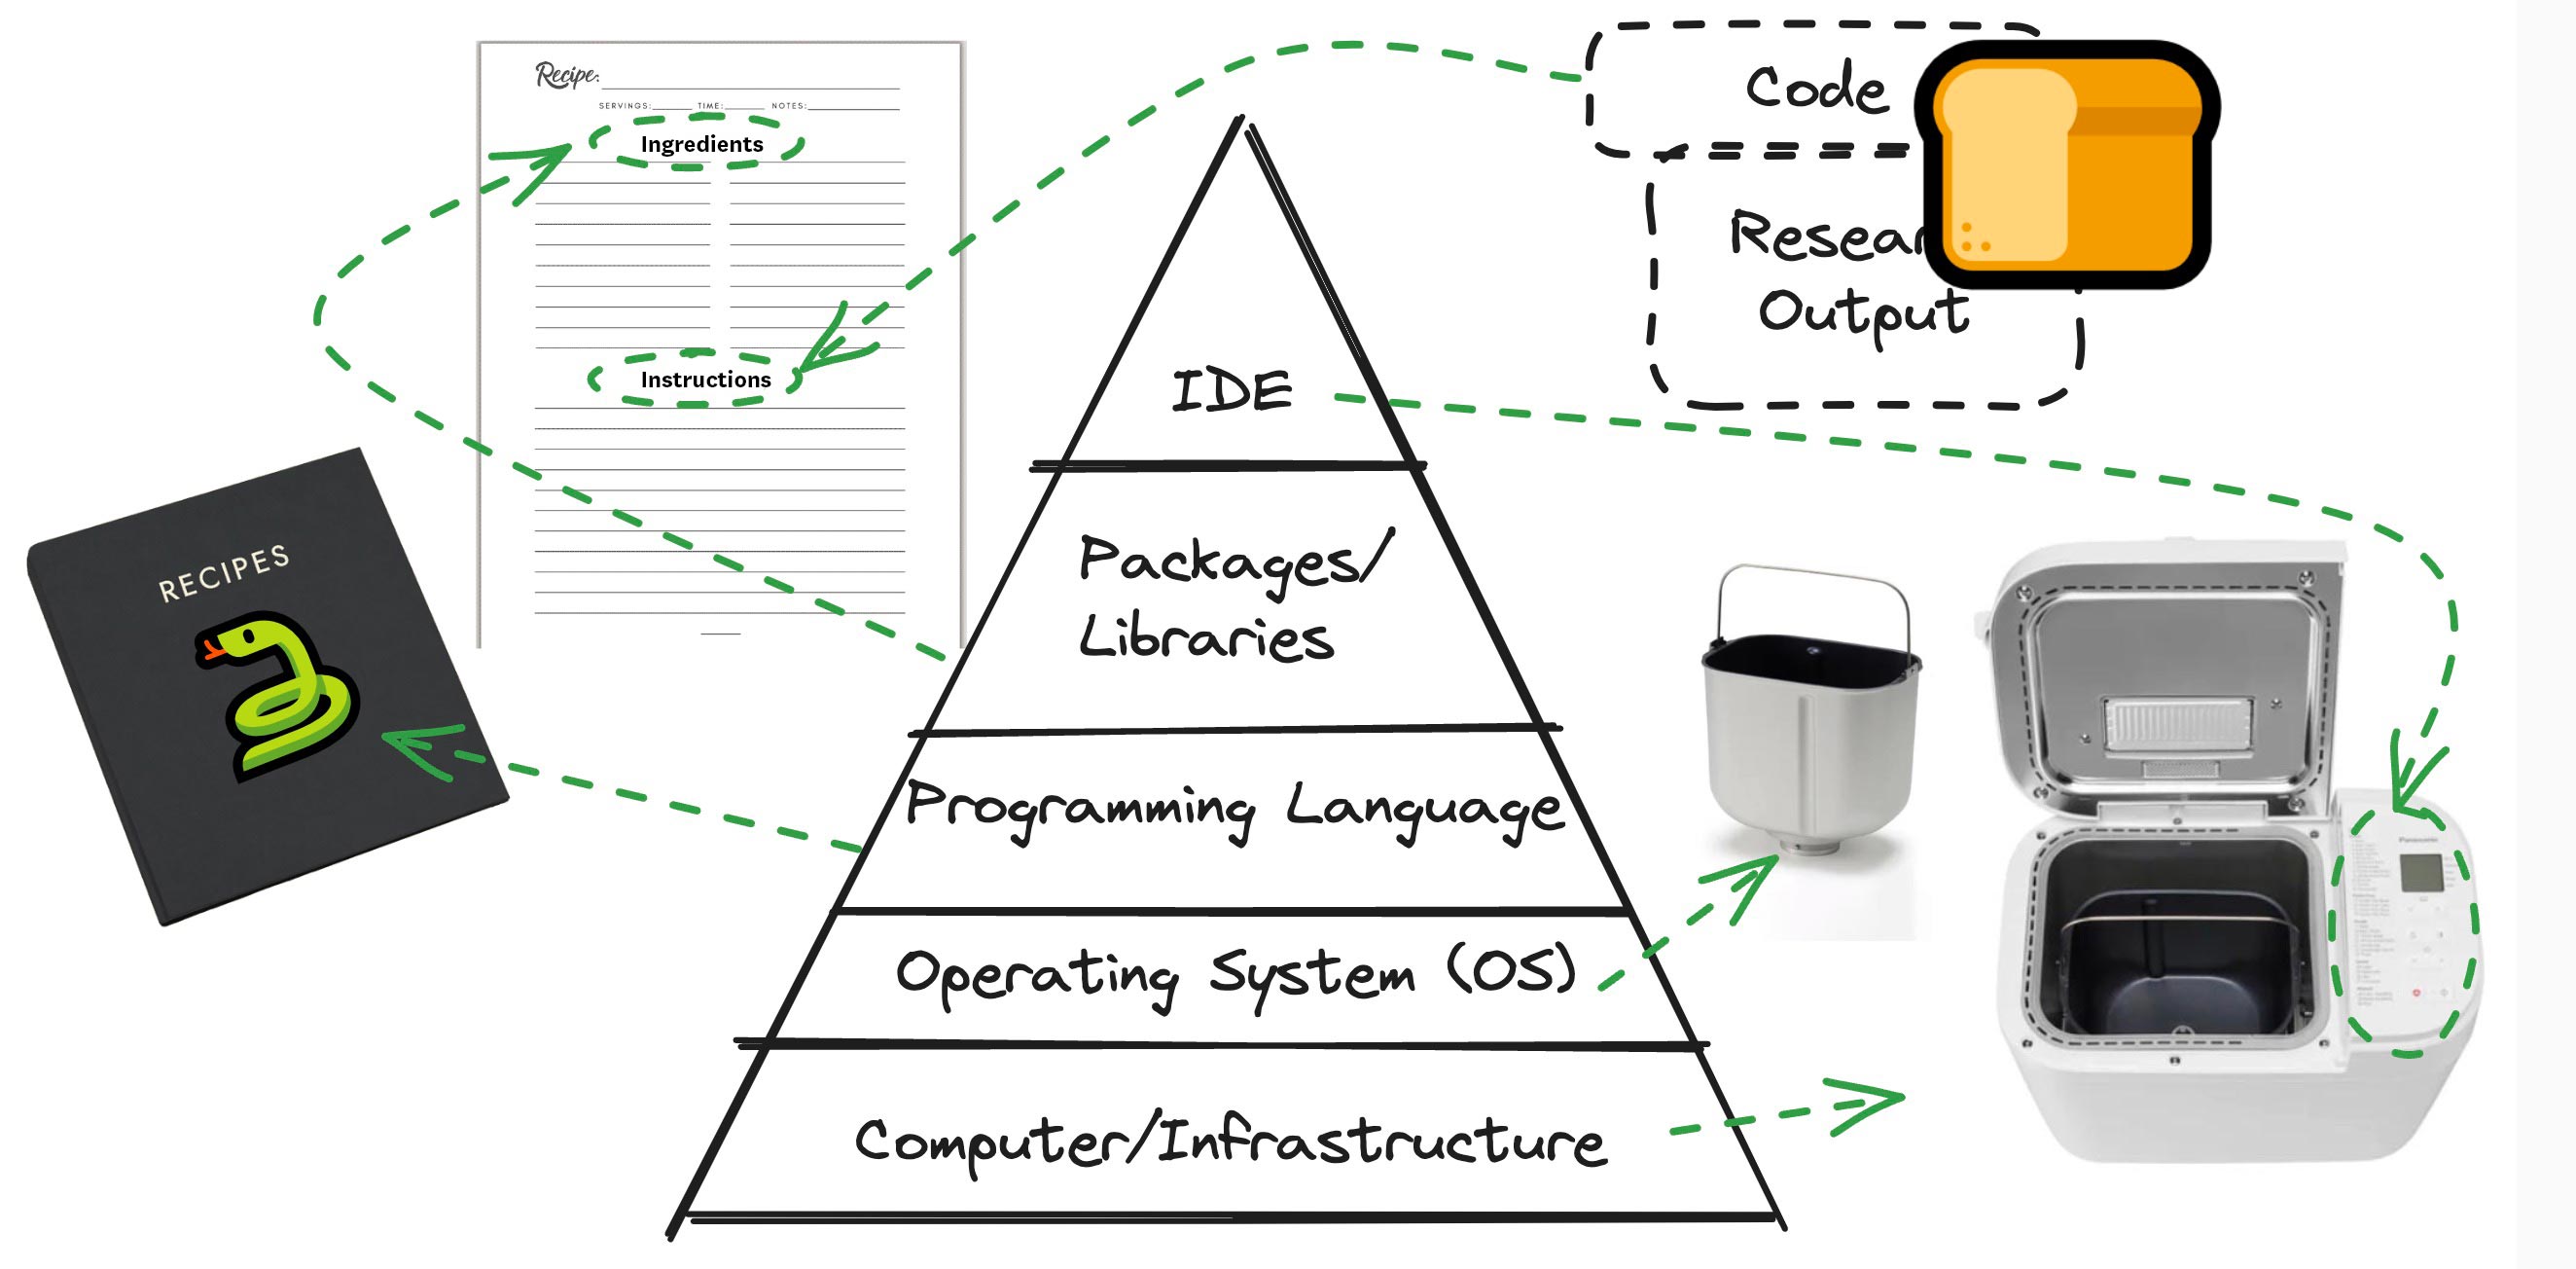
Let’s iterate: The pyramid adapted to baking bread 🍞

Finally: The geospatial example

  • this was quite a lot to take in
  • we used the Pyramid
    • we revisited it from multiple perspectives
  • With only 5 lines of code, we looked at stock prices
  • we thought about yummy bread 🍞

Mapping our geospatial example to the Pyramid

Category Details
Data Input Download dataset 1 & 2
Computer We use a VM (on Nectar)
OS We use Ubuntu 22.4
Language Python
Libraries geopandas among others
IDE VSC to run a Jupyter Notebook (ssh to VM)
Code On GitHub
Research Outputs Map published to website/GitHub Action (bit out of scope)

Background

Rough workflow:

  • We download a dataset that contains the boundaries of New Zealand’s Statistical Areas (SA2) - details follow
  • And another one that contains the population (i.e. the number of people) of each SA2
  • We want to plot the boundaries and the population data on an interactive map in a browser
  • We put that on GitHub/a website

Details:

  • StatsNZ decomposes New Zealand into Statistical Areas (SA)
    • each SA should encapsule people of similar socio-economical status
    • there are 3 resolutions (SA1 = up to 500 people, SA2 = 1k-4k people, SA3 = 5k-50k people)
    • we pick SA2

Live demo

What I did as a preparation (which exceeds the available time for this session):

  • create a Ubuntu VM on Nectar
  • start VSC on my local machine, connect to the VM via SSH
  • as Ubuntu comes with Python, I created a virtual environment (that I named data)
    • sudo apt install python3.12-venv
    • python3 -m venv data
    • source data/bin/activate
    • start a new terminal, done (notice the first bit on the prompt)
  • I installed Jupyter and GitHub Pull Requests exentsions and signed in to GitHub
# We download the first dataset
!wget "https://github.com/UoA-eResearch/SA2_2022_population/raw/main/statistical-area-2-2023-generalised_simplified_22.3%25.zip"

# !pip install geopandas
import geopandas as gpd
import pandas as pd

# Load dataset into geopandas df, have a look
sa2 = gpd.read_file("statistical-area-2-2023-generalised_simplified_22.3%.zip").dropna(subset="geometry")
sa2

# we remove Chathan Islands and those with no land area
sa2 = sa2[(sa2.SA22023__1 != "Chatham Islands") & (sa2.LAND_AREA_ > 0)].copy()
sa2

# We download the second dataset
!wget "https://raw.githubusercontent.com/UoA-eResearch/SA2_2022_population/main/population_by_SA2.csv"

# we import a population dataset
population = pd.read_csv("Data2024Assets/population_by_SA2.csv")
population

# Extract ID from Area col by using RegEx
population['SA2'] = population['Area'].str.extract(r'(\d+)')
population

# Add a prefix to the right dataframe's columns (excluding the merge key)
prefix = 'population_in_year_'
population= population.rename(columns={col: prefix + col for col in population.columns[1:10]})
population

# Merge these
sa2 = sa2.merge(population, left_on='SA22023_V1', right_on='SA2')
sa2

Questions

  • please see the explanation above
  • the likelihood of me being able to answer your question now is quite slim
    • a lot of content in 1h
  • Come to HackyHour or the Drop-in Clinic

Joining the dots for modern data science workflows